Consumer Trends

Top 20 Fruits and Vegetables Sold in the U.S.

Overall sales of produce were up modestly in 2023 (+1.5%), an increase driven by price (+1.6%) rather than volume (-0.1%). Growth in fruit (+1.7%) and Vegetables (+1.2%) were comparable. According to Circana’s household panel data, this pattern is born out in household buying trends in 2023. The percent of households buying fruits and vegetables was flat, but the number of product trips and dollars spend per trip were up slightly (<1%).

2023 saw continued softening in households purchasing of many of the most popular fruit and vegetables, including potatoes (-0.9%), bananas (-0.7%), Onions (-0.6%), and Apples (-1.0%). The biggest bounceback, however, came from cherries (+4.1%), which had been down in 2022. This growth correlates with increased volume sales in the face of low prices (-21.4%). 
Fresh Fruits 

1.

bananas - 84%

2.

berries - 82%

3.

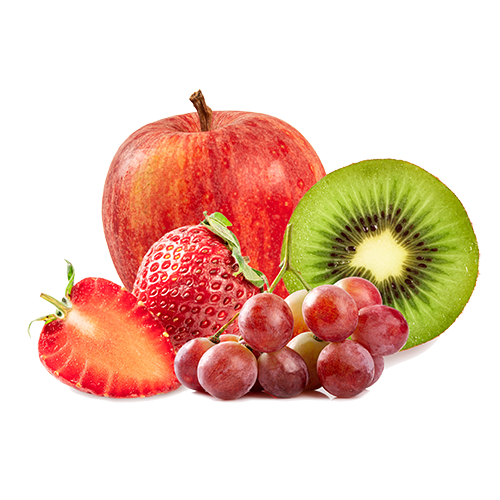
apples - 77%

4.

grapes - 74%

5.

melons - 68%

6.

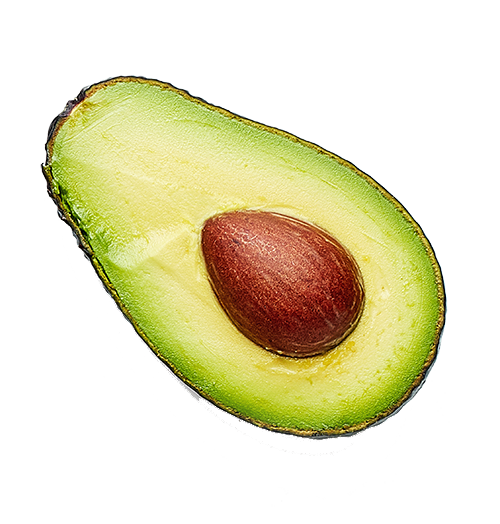
avocados - 56%

7.

mandarins - 53%

mandarin orange
8.

oranges - 49%

10.

pineapple - 45%

11.

cherries - 40%

12.

pears - 27%

13.

lemons - 25%

14.

mixed fruit - 18%

15.

limes - 16%

16.

kiwis - 15%

17.

grapefruit - 12%

18.

mangoes - 10%

19.

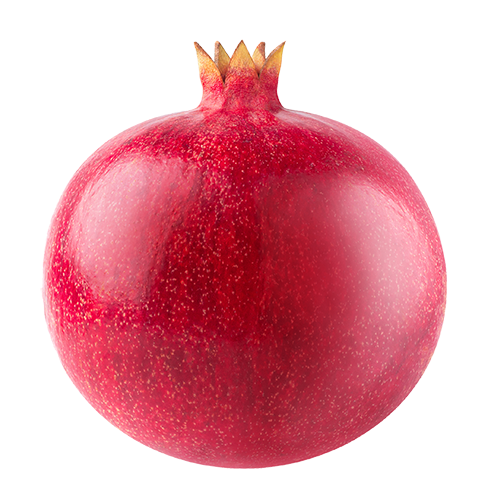
pomegranates - 6%

20

tangerines - 3%

Fresh Vegetables

1.

potatoes - 85%

2.

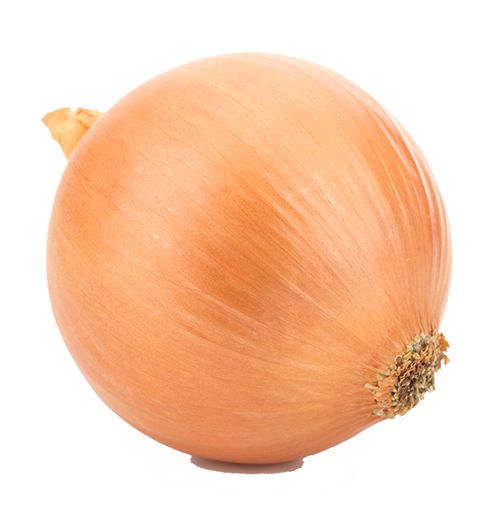
onions - 83%

3.

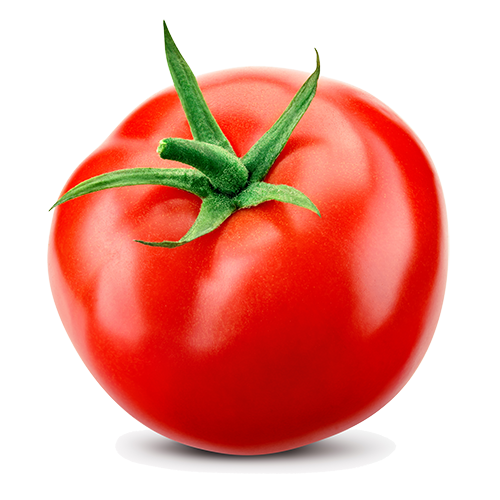
tomatoes - 80%

4.

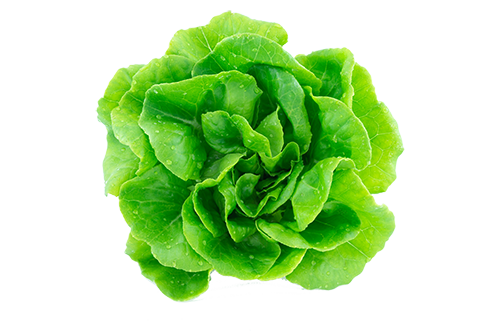
lettuce - 80%

5.

carrots - 77%

6.

peppers - 72%

7.

cucumbers - 64%

8.

celery - 62%

9.

salad kits - 52%

10.

broccoli - 51%

11.

mushrooms - 48%

12.

spinach - 47%

13.

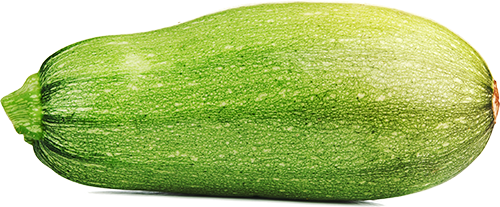
squash - 46%

14.

corn - 46%

15.

cabbage - 42%

16.

green beans - 31%

17.

cauliflower - 28%

18.

garlic - 25%

19.

asparagus - 19%

20.

brussels sprouts - 17%

Related Resources