
Menu prices are increasing with menus seeing an overall average price growth of 2.7% in 2023
Technomic
In today’s economy, it is difficult to predict consumer behavior. Daily eating behaviors changed after the pandemic with less consumers eating lunch out the home or grabbing a quick bite while on the go.
To entice cost conscious consumers, quick serve operators turned to value meals. At the same time, fine dining is experiencing growth as consumers return to viewing dining as an experience rather than a just a convenience.
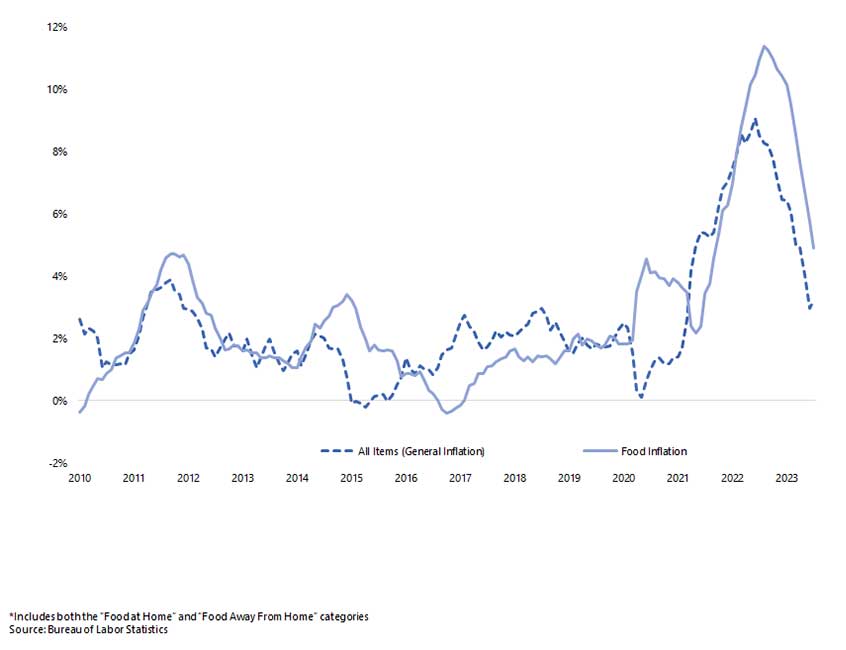
U.S. Consumer Price Indicies (Inflation)
12-Month Change %
Inflation rate for food July '23 4.9%
Inflation rate for all items July '23 3.2%
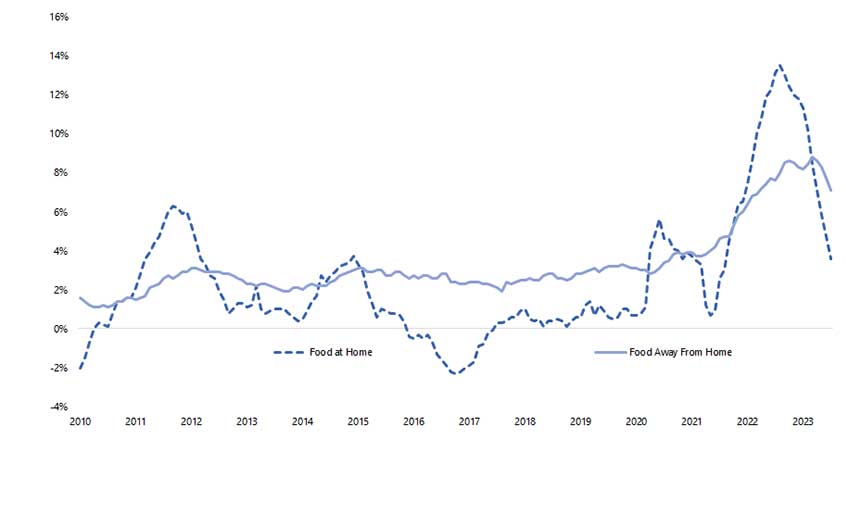
U.S. Consumer Price Indices (Inflation)
12-Month Change %
Inflation rate food away from home July '23 - 7.1%
Inflation rate food at home July '23 - 3.6%
According to Technomic, almost 20% of operators have a value meal on their menu, compared to 18.9% in Q2 2022. And the number of value meals on menus has increased 15% offering consumers more variety in the types of value meals.
Sandwich, chicken and pizza value meals are the most popular value entrees on menus, but there is growth in beef (+39%), pork (+28%), chicken (+28%) value meals to vegetable (+44%), and pasta/noodle (+27%).
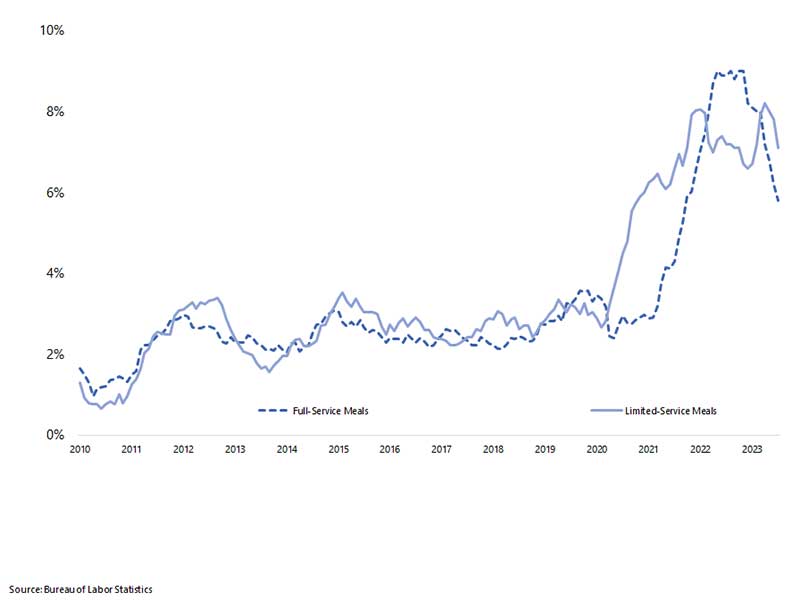
U.S. Consumer Price Indices (Inflation)
12-Month Change%
Inflation Limited Service July '23 7.1%
Inflation Full Service July '23 5.8%
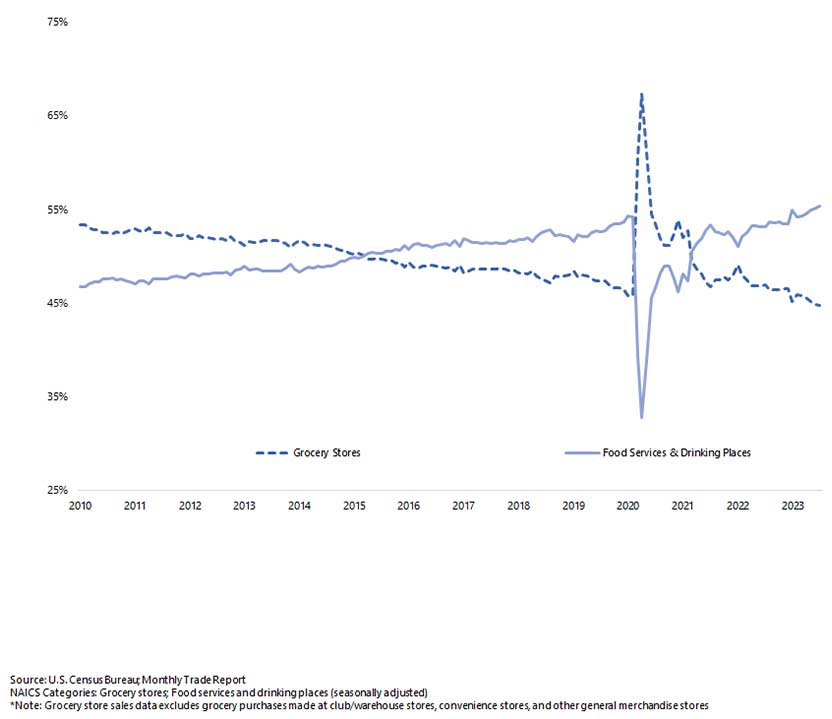
U.S. Food Industry Sales Share Analysis
Foodservice vs. Grocery Store Sales
Foodservice Share July '23 - 55.3%
Grocery Share July '23 - 44.7%
Yelp analyzed consumer interest in restaurants across different price points, ranging from $ to $$$$ between April 2022 and March 2023 compared to the same period the year prior. The data suggested that although menu prices increased, consumers are splurging when dining-out. Consumers appear to be forgoing affordable options for higher-end dining experiences. In fact, consumer interest for low price point restaurants ($) decreased by 4% nationally, while states such as Nevada (down 12%), Utah (down 11%) and Oregon (down 10%) saw the largest decreases.
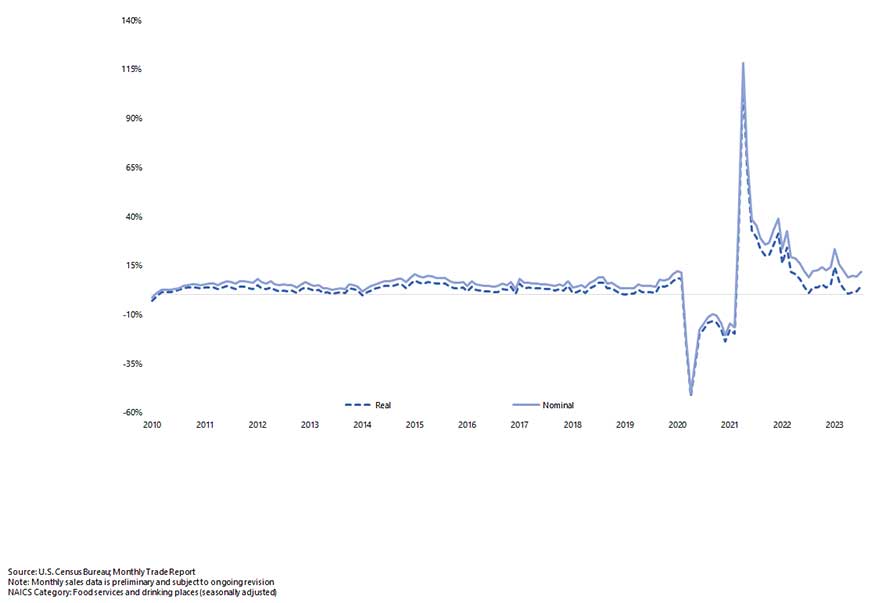
U.S. Foodservice Industry Sales
Year-Over-Year Sales Performance
Foodservice Nominal Sales July '23 - 11.9%
Foodservice Real Sales July '23 - 4.4%
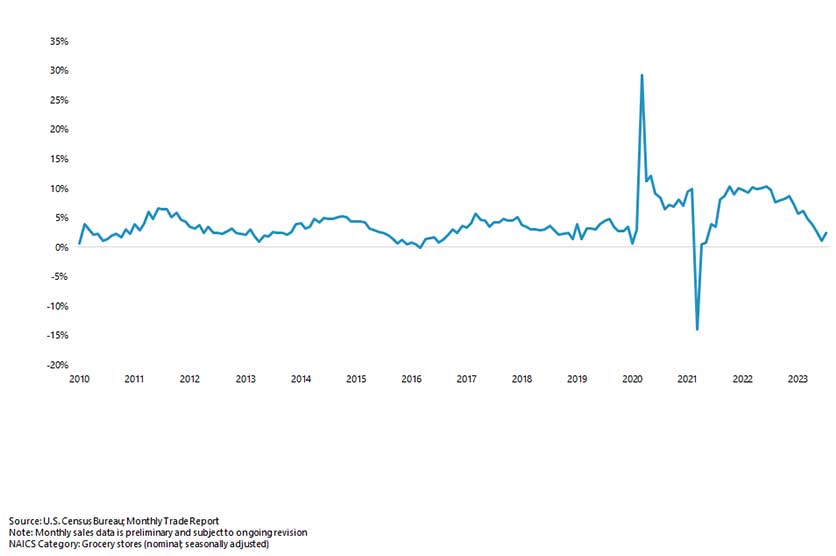
U.S. Grocery Store Sales
Year-Over-Year Sales Performance
Grocery Store Sales July '23 - 2.3%
Yelp data revealed that fine dining is not dead. When compared to pre-pandemic levels (April 2019 through March 2020), consumer interest decreased nearly 16% for traditionally affordable restaurants ($). Notably, interest in higher priced restaurants ($$$ and $$$$) rose nearly 10% and 17%, respectively, compared to pre-pandemic levels. We continue to see this trend year over year, with consumer interest up nearly 2% for both pricing designations ($$$ and $$$$).